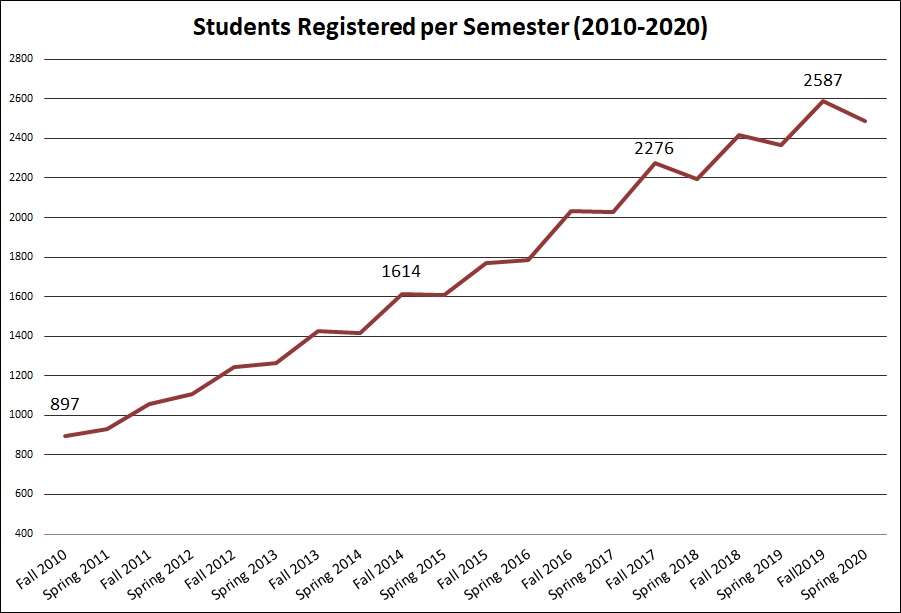
A brief summary of the numbers of students and types of disabilities served by Disability Resources.
Total Students Registered for Services
by Academic Year per Semester
| Academic Year | Fall | Spring | Summer |
|---|---|---|---|
| 2005-2006 | 635 | 645 | 151 |
| 2006-2007 | 666 | 629 | 133 |
| 2007-2008 | 674 | 639 | 148 |
| 2008-2009 | 739 | 710 | 160 |
| 2009-2010 | 765 | 741 | 172 |
| 2010-2011 | 897 | 929 | 220 |
| 2011-2012 | 1059 | 1108 | 235 |
| 2012-2013 | 1244 | 1262 | 276 |
| 2013-2014 | 1425 | 1418 | 341 |
| 2014-2015 | 1614 | 1608 | 395 |
| 2015-2016 | 1768 | 1783 | 470 |
| 2016-2017 | 2034 | 2027 | 533 |
| 2017-2018 | 2276 | 2196 | 544 |
| 2018-2019 | 2416 | 2364 | 566 |
| 2019-2020 | 2587 | 2488 | 892 |
| 2020-2021 | 2840 | 2860 |
Number of Disabilities (Diagnoses) by Category
| Category | Fall 2009 |
Fall 2010 |
Fall 2011 |
Fall 2012 |
Fall 2013 |
Fall 2014 |
Fall 2015 |
Fall 2016 |
Fall 2017 |
Fall 2018 |
Fall 2019 |
Fall 2020 |
|---|---|---|---|---|---|---|---|---|---|---|---|---|
| ADHD | 348 | 426 | 522 | 637 | 697 | 789 | 858 | 955 | 1041 | 1043 | 1089 | 1285 |
| Autism | 12 | 17 | 17 | 20 | 27 | 31 | 26 | 38 | 36 | 55 | 73 | 104 |
| Deaf/Blind | 1 | 1 | 1 | 0 | 0 | 1 | 2 | 1 | 1 | 2 | 2 | 1 |
| Health Related | 114 | 137 | 177 | 228 | 276 | 313 | 350 | 414 | 499 | 591 | 655 | 687 |
| Hearing/Deaf | 49 | 38 | 44 | 53 | 50 | 69 | 84 | 89 | 102 | 90 | 88 | 74 |
| Intellectual | 0 | 0 | 0 | 0 | 0 | 0 | 0 | 0 | 0 | 0 | 6 | 7 |
| Learning | 448 | 480 | 484 | 523 | 534 | 589 | 664 | 800 | 923 | 905 | 933 | 985 |
| Mental Health | 216 | 248 | 287 | 318 | 378 | 452 | 523 | 692 | 829 | 982 | 1022 | 1178 |
| Physical | 37 | 31 | 48 | 60 | 63 | 69 | 79 | 100 | 131 | 127 | 139 | 114 |
| Speech Impairment | 15 | 17 | 11 | 22 | 20 | 19 | 27 | 32 | 36 | 35 | 39 | 42 |
| Temporary | 16 | 17 | 20 | 19 | 28 | 30 | 22 | 34 | 43 | 34 | 50 | 22 |
| Traumatic Brain Injury | 17 | 24 | 29 | 29 | 31 | 47 | 48 | 58 | 50 | 49 | 46 | 49 |
| Visual/Blind | 48 | 64 | 61 | 46 | 74 | 78 | 98 | 100 | 81 | 59 | 70 | 72 |


